|
Geographic information system in reshaping agriculture
By Muhammad Sabir
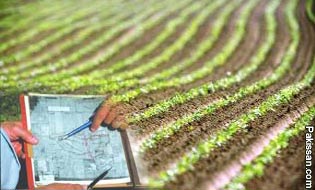
THE geographical information system (GIS), a digital mapping
system with computer. It helps manage agriculture by
storing, retrieving, manipulating, analysing and displaying
information through maps. Its key components are computer
system, geospatial data and users.
 Farmers
can increase production, reduce input costs, and manage the
land more efficiently by using the GIS. Mapping in the field
with micro computer to scientific analysis of production
data in the farm manager's office can be easily performed
with the help of the GIS system.ArcPad software can be used
on handheld computers in the field for the creation,
visualization, and interpretation of data. Farmers can
indicate stresses the crop faces like pest infestations,
nutrient deficiencies, and water shortages by making maps
with the GIS. These stresses are highlighted on the ArcPad
map and the information is stored in a format that is usable
in other software products. By collecting such data in the
field, solutions can be devised and preventative measures
outlined. Farmers
can increase production, reduce input costs, and manage the
land more efficiently by using the GIS. Mapping in the field
with micro computer to scientific analysis of production
data in the farm manager's office can be easily performed
with the help of the GIS system.ArcPad software can be used
on handheld computers in the field for the creation,
visualization, and interpretation of data. Farmers can
indicate stresses the crop faces like pest infestations,
nutrient deficiencies, and water shortages by making maps
with the GIS. These stresses are highlighted on the ArcPad
map and the information is stored in a format that is usable
in other software products. By collecting such data in the
field, solutions can be devised and preventative measures
outlined.
As weather is a key component in agricultural production,
weather updates can be seen on the Internet via a handheld
telephone or Wide Area Network (WAN). ArcPad has a
developer's toolkit that allows customized applications that
provide field-workers simple forms to fill in that
automatically create data attributes. It was really
cumbersome to create necessary data sets for the field or
subfield level but now this task has become easy with the
help of ArcPad. ArcPad is the farmer's modern shirt pocket
notepad. Farmer's will be able to collect whatever
information is relevant to them at that moment and enter it
to its proper field location through maps.
The GIS requires access to different data and fully
integrated computer system for easy decision making. Arial
photographs are in use in agriculture since long however,
with the adoption of the GIS, these can be used more
effectively. Such data is generally raster based, that is to
say, made up of a patchwork of discrete cells or pixels.
Data layers that are made up of points, lines, and polygons
are known as vector data. Raster data can be combined with
vector data, but it requires different tools for management
and interpretation. The ArcView Image Analysis extension
provides the farmer with the necessary tools to carry out
simple procedures that greatly increase the return on
investments made in satellite images or aerial photographs.
This can be used to estimate crop yields, assessment of the
areas that are suffering from different stress perhaps
caused by a specific pest, and the identification of areas
of land suffering from soil erosion.
Field data collection takes the form of single points that
need to be processed to achieve what is known as a continual
data layer. Interpolation describes this process of taking
many single points and creating a complete surface, the gaps
being filled based on the spatial statistics of the original
points. Such points might include crop yield data collected
from a combine harvester, soil samples collected manually
throughout a farm, or water quality information collected
from watering points or wells. Interpolating these points
will produce more useful information for the farmer such as
crop yield maps, soil chemistry maps, and maps related to
water chemical content, for example the degree of nitrate
contamination.
Once the farm analyst has identified the agronomically
troubled areas of fields, he or she can use ArcView Spatial
Analyst to look for relationships in the data. Yield monitor
data maps indicate the low yield at some area and
relationship between the low yield and different factors in
the field can be established with help of Arch View Spatial
Analyst. Factors causing the low yield may be slope,
moisture, fertility, or poor pesticide performance. These
factors can be managed in proper way to increase the yield.
Progressive farmers and managers who need additional data
interpolation support for variable rate technology (VRT)
farming will be assisted by the ability to customize ArcView
Spatial Analyst. The VRT farming can be adopted by using the
Avenue programming language and Model Builder. Model Builder
is a powerful, graphically driven tool that allows farmers
to create and test different land use scenarios before
actually implementing them. For example, a farmer could
calculate the potential economic yield for a harvested crop
before actually planting it.
If you have not used the GIS, then consider starting with
the Model Builder. It allows the user to undertake agronomic
analyses without extensive GIS training. Another feature of
the Model Builder is its documentation function. A farmer,
an agronomist, and an agricultural economist could all look
at the same farm management situation and solve it in three
different ways. The Model Builder documents each sequential
spatial operator and process used. This allows the three
users to compare each others' models. The ability to
interpolate point information is necessary for carrying out
such tasks as hydrological modelling, land/crop suitability
studies, or predicting crop yields. All these activities and
more can be made possible by using ArcView Spatial Analyst.
Agriculture is no more a way of earning one’s livelihood
but is now a business. Knowledge of accounting, agricultural
legislation, subsidy guidelines, taxation regulations, and,
crop insurance are important for progressive farmers to
harvest maximum benefit.
To interpret all this information is cumbersome job but if
all the data is available as a series of maps, each one
telling a specific story to a specialized audience; then the
system would become more efficient and productive. One of
the most obvious and immediate outputs from a farm GIS is
maps that provide with new insight. Planning applications,
filing tax returns, and claiming crop subsidies are
available in the form of maps. ArcView delivers a
professional standard map production capability and is
certainly a cost-effective solution.
Detailed schedules for field-workers can be assisted by
instructing them to use both maps and written instructions.
This also gives the benefit to the manager of cost
accountability, and if necessary, the means to measure staff
efficiency based on planned performance evaluations.
Precision farming uses precise data to map the yield of
various crops at the subfield scale; the aim being to
increase yields by applying crop inputs, pesticides,
fertilisers, and irrigation water at an optimum level. Once
calculated and reported in the form of an interpolated map
layer, the data needs to be translated into a format that
the variable rate technology (VRT) electronic controller can
use. The application field implements can use this field
prescription to add field inputs only where they are
required. ArcView can export such outputs in
industry-standard formats and also supports the programming
of additional modules should the case arise.
The GIS is being used for agricultural resources management
on sustainable basis. It makes soil management less tedious
and less costly by collecting a wider spectrum of data in
short time. Conventional surveys of soil erosion in the
field are costly in time and labour. The GIS-assisted
physical models are now available which can predict where
erosion "hot-spots" are likely to occur. Road construction
is also important. The model could thus be used to identify
sites which are vulnerable to erosion, and where
conservation measures are needed.
Efforts should be made to adopt the GIS, with the aim of
counteracting the negative effects of development, such as
soil erosion, soil salinity, soil pollution and flooding.
Unless these can be reversed, they will cumulatively reduce
the carrying capacity of land and soil resources over the
years. The GIS is a significant tool to manage soil resource
sustainably, restoring their productivity for future
generations.
The GIS could also be used in predicting the effects of
surface cover on the discharge of water and soil sediments
from the catchment area. The rate of soil and water loss
from bare soil is compared to vegetative cover with minimum
conservation measures, the same cover with full conservation
measures, and forest cover. The GIS can be used to help
small-scale farmers to improve their fertiliser
applications. Decision support systems can be developed
which will be able to provide site-specific fertiliser
recommendations.
The GIS can improve the understanding of farming areas, help
promote agricultural development and assist in identifying
and handling issues important to strengthening farming.
Courtesy: The Dawn
|
Pakissan.com;
|